Health checks on API end points of any given middle layer service as well as method calls to get the state of the platform, the methods are solely for health checking, no other uses business or otherwise.
It is good practice—and often a business requirement—to monitor web applications, and middle-tier and shared services, to ensure that they are available and performing correctly. However, it is more difficult to monitor services running in the cloud than it is to monitor on-premises services. For example, you do not have full control of the hosting environment, and the services typically depend on other services provided by platform vendors and others.
There are also many factors that affect cloud-hosted applications such as network latency, the performance and availability of the underlying compute and storage systems, and the network bandwidth between them. The service may fail entirely or partially due to any of these factors. Therefore, you must verify at regular intervals that the service is performing correctly to ensure the required level of availability—which might be part of your Service Level Agreement (SLA).
Implement health monitoring by sending requests to an endpoint on the application. The application should perform the necessary checks, and return an indication of its status.
A health monitoring check typically combines two factors: the checks (if any) performed by the application or service in response to the request to the health verification endpoint, and analysis of the result by the tool or framework that is performing the health verification check. The response code indicates the status of the application and, optionally, any components or services it uses. The latency or response time check is performed by the monitoring tool or framework. Below shows an overview of the implementation of this pattern.
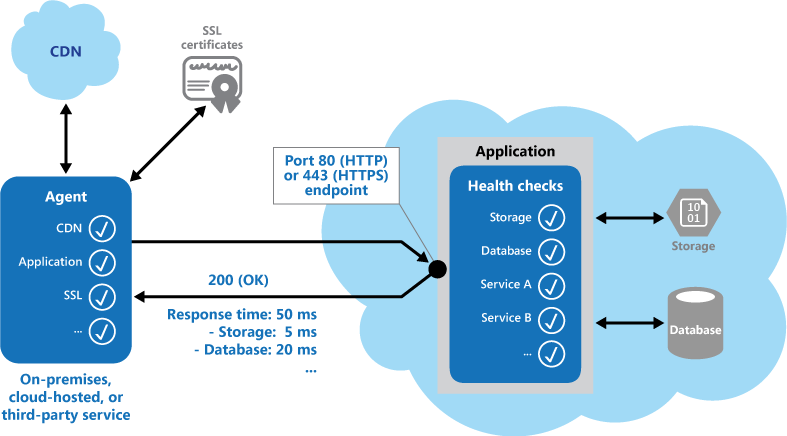
Overview of the pattern
Additional checks that might be carried out by the health monitoring code in the application include:
Several existing services and tools are available for monitoring web applications by submitting a request to a configurable set of endpoints, and evaluating the results against a set of configurable rules. It is relatively easy to create a service endpoint whose sole purpose is to perform some functional tests on the system.
Typical checks that can be performed by the monitoring tools include:
It is also useful, where possible, to run these checks from different on-premises or hosted locations to measure and compare response times from different places. Ideally you should monitor applications from locations that are close to customers in order to get an accurate view of the performance from each location. In addition to providing a more robust checking mechanism, the results may influence the choice of deployment location for the application—and whether to deploy it in more than one datacenter.
Tests should also be run against all the service instances that customers use to ensure the application is working correctly for all customers. For example, if customer storage is spread across more than one storage account, the monitoring process must check all of these.
This pattern is ideally suited for:
 Systems